In most modern industrial economies, the private market produces and distributes goods. One of the oldest claims in economics is that this form of organization leads to an efficient allocation of resources. But if that is true — why do we need a government at all?
1 · Adam Smith's Invisible Hand
In the Wealth of Nations (1776), Adam Smith coined the famous metaphor:
"He intends only his own gain, and he is in this, as in many other cases, led by an invisible hand to promote an end which was no part of his intention. Nor is it always the worse for the society that it was no part of it. By pursuing his own interest he frequently promotes that of the society more effectually than when he really intends to promote it."
The intuition: when firms chase higher profits, they produce the goods consumers are willing to pay for. When consumers buy as cheaply as possible, orders flow to the most efficient producers. The market coordinates without any central planner.
2 · Pareto Efficiency
Modern economists sharpen Smith's idea with the concept of Pareto efficiency:
Pareto efficiency is a weak standard — it says nothing about distribution. A world in which one person owns everything and everyone else starves can be Pareto efficient (any redistribution would make the rich person worse off). And the other way around: an allocation in which no one can be made better off without making others worse off can still be highly unequal.
Two properties:
- Individualistic: the concept accepts people's preferences as they are — no paternalistic claim about what the "right" preferences should be.
- Consumer sovereignty: each person is the best judge of their own well-being.
3 · The Two Fundamental Theorems of Welfare Economics
The two most important results in welfare economics:
The theorems have a strong policy implication: efficiency and distribution are analytically separable. The government can focus on redistributing initial endowments and then use the market for allocation — without manipulating prices.
4 · Efficiency from the Perspective of a Single Market
In the standard supply-and-demand model:
- The demand curve shows the marginal benefit of an additional unit to consumers.
- The supply curve shows the marginal cost of an additional unit to producers.
- In market equilibrium: marginal benefit = marginal cost.
If MB > MC, more should be produced (a Pareto improvement is possible). If MB < MC, too much is being produced — cutting back improves welfare. Only when MB = MC is the allocation efficient. That is exactly what the competitive market delivers.
5 · From a Single Market to General Equilibrium
In general equilibrium there are four markets:
- Product market — e.g. apples, oranges.
- Factor market — e.g. labor, capital.
- Market linkages — the output of one market is an input to another.
- Future markets — saving links today's and tomorrow's consumption decisions.
In general equilibrium, Pareto efficiency requires three conditions — exchange, production, and product mix.
6 · Exchange Efficiency
Given a fixed total output: how should the goods be distributed across consumers? The answer:
MRSAX,Y = MRSBX,Y for all consumers A, B and all pairs of goods (X, Y).
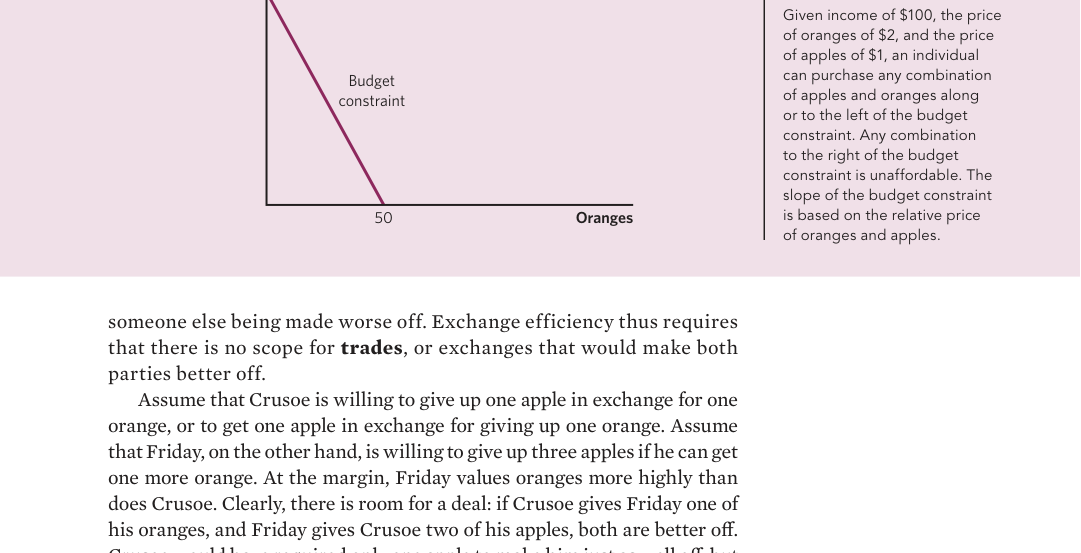
Intuition: if consumer A is willing to give up 2 oranges for 1 apple, while B is willing to give up 3 oranges, there is a trade that makes both of them better off. As long as the MRS values differ, the allocation is not Pareto efficient.
Indifference curves are the tool: they show the combinations of goods between which a consumer is indifferent (same utility level). The slope of an indifference curve is exactly the MRS.
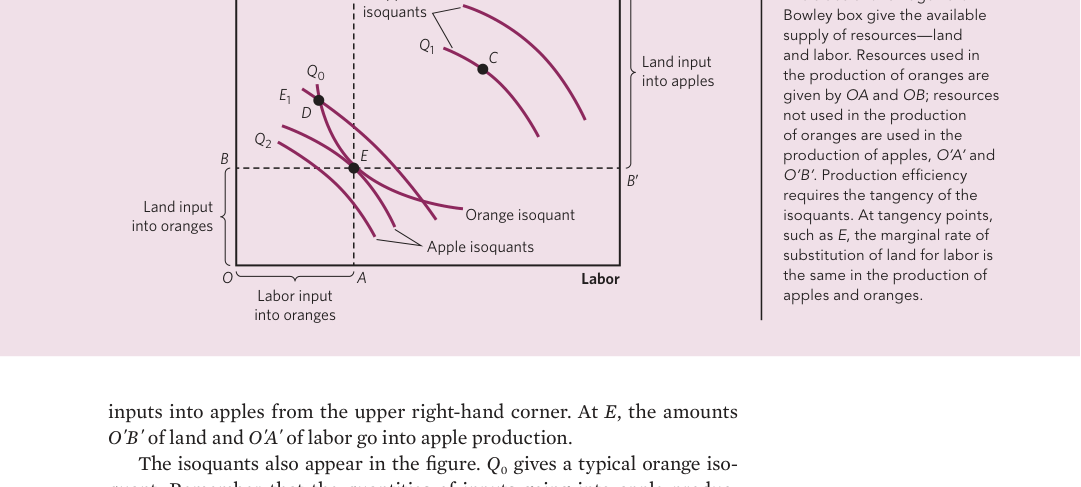
7 · Production Efficiency (Input Efficiency)
Given the total amount of inputs being used: are they distributed efficiently across producers?
MRTSFirm1 = MRTSFirm2 for all firms and all input pairs.
Tool: isoquants — the combinations of inputs that produce the same level of output. Slope = MRTS.
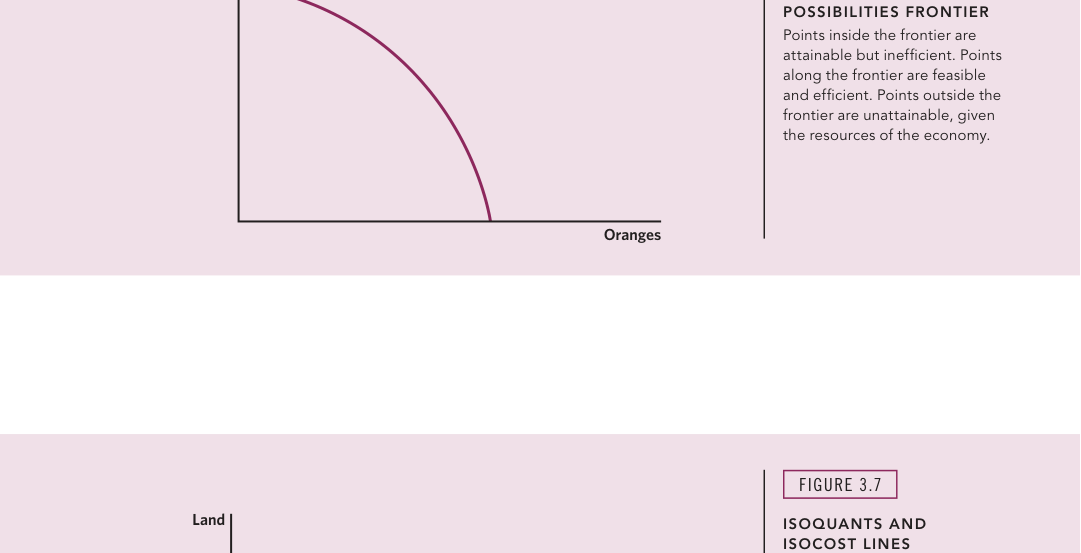
8 · Product Mix Efficiency (Substitution Efficiency)
Which mix of goods should be produced? This question ties supply and demand together.
MRTX,Y = MRSX,Y
Intuition: the MRT tells you how much Y the economy could technically produce if it gave up one unit of X. The MRS tells you how much Y consumers are willing to give up for one unit of X. When the two diverge, a Pareto improvement is available.
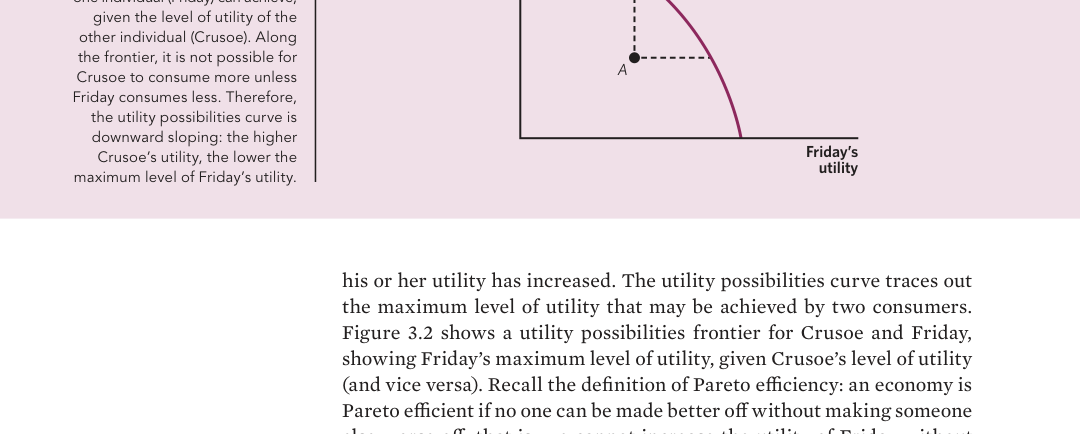
9 · Utility Possibilities Frontier
An alternative way to picture Pareto efficiency: the utility possibilities curve. For two consumers (Crusoe and Friday), it shows the maximum reachable combinations of utility.