ECON 132 · Public Economics
Chapter 5 · Stiglitz / Rosengard

Public Goods & Publicly Provided Private Goods

What distinguishes a public good from a private one? Why does the market fail? How much of a public good should be produced — and how do we measure it?

The state provides a wide variety of goods, from national defense to education. What are the economic properties of these goods? How do they differ from ice cream or clothing? And how much should be produced?

1 · The Two Basic Questions

To distinguish public goods from private goods, economists ask two questions:

  1. Is consumption rival? If one person uses the good, can another no longer use it? Example: an apple = rival. Lighthouse light = non-rival.
  2. Is exclusion possible? Can people who do not pay be excluded from consuming the good? Example: movie tickets = excludable. National defense = non-excludable.

2 · Classification of Goods

The two questions together generate a 2×2 scheme:

Classification of goods
Figure 5.1 · Classification The two dimensions (rivalry × excludability) yield four quadrants: pure public goods, pure private goods, and two "impure" in-between forms.
  • Pure public good (non-rival + non-excludable): national defense, basic research, lighthouse light.
  • Pure private good (rival + excludable): apples, clothing, ice cream.
  • Club good (non-rival + excludable): cable television, toll roads at low utilization, private country clubs.
  • Common-pool resource (rival + non-excludable): fish stocks in the ocean, common pasture land, free roads in congestion.

3 · Non-Rival but Excludable: Club Goods and User Fees

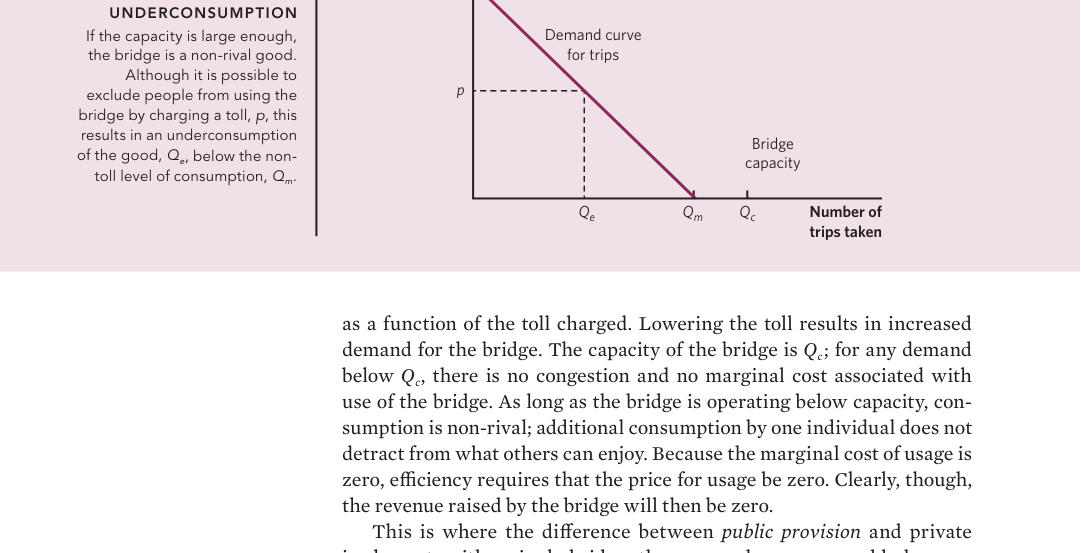
Example: a bridge with a toll booth. As long as the bridge is operated below its capacity, an additional car costs nothing — consumption is non-rival. But the toll booth makes exclusion possible.

Toll bridge and utilization
Figure 5.2 · Toll and Utilization As long as demand is below capacity Qc, the marginal cost contribution is zero. Only when capacity is exceeded does consumption become rival (congestion). The efficient toll: 0 at under-utilization, positive at over-utilization.
Toll Efficiency Paradox A toll on an underused bridge deters potential users — even though their consumption costs nothing! Result: underconsumption. This is the economic argument for free use of some infrastructure (or at least low flat-rate financing instead of tolls).

When deciding on toll structures, governments weigh equity (fair distribution) against efficiency (correct incentives).

4 · Non-Excludable: Free Riders and Private Provision

When exclusion is not possible (national defense, clean air), the market either does not produce the good at all or produces too little of it. Free Rider Problem: if everyone hopes that others will pay, no one pays.

Rare exceptions exist where a single large consumer benefits so much that they finance the good alone (example: beekeeping for one's own honey production automatically provides pollination for neighbors). But the rule is: non-excludable goods need the state.

5 · Publicly Provided Private Goods

Here comes something surprising: some goods that are technically private goods (rival, excludable) are nevertheless provided publicly. Examples:

  • Education in public schools (rival in class size).
  • Water from the municipal network (rival).
  • Police protection (partially rival).

Why public provision? Three reasons:

  1. Transaction costs: charging a toll on every road is more expensive than free provision financed through taxes.
  2. Externalities: education has positive externalities — the market would provide too little.
  3. Distributional goals: some goods (health, education) should be available regardless of income.
Underconsumption with user fees
Figure 5.3 · Underconsumption For a non-rival good: a user fee p produces consumption Qm, but the efficient quantity would be Qe (where p = 0 — up to capacity). The shaded triangle is the welfare loss from underconsumption.
Overconsumption with free provision
Figure 5.4 · Overconsumption For free provision of a private good (with real marginal costs): consumers consume Q0 instead of the efficient Qe. The shaded area is the efficiency loss from overconsumption — the marginal consumer values the good less than its production cost.

6 · Three Rationing Methods

For publicly provided private goods a problem arises: if the good is not sold at a market price, how do we distribute it?

1 · User Fees

Advantage: those who benefit pay. Reduces overconsumption.
Disadvantage: underconsumption for non-rival goods; administrative costs.

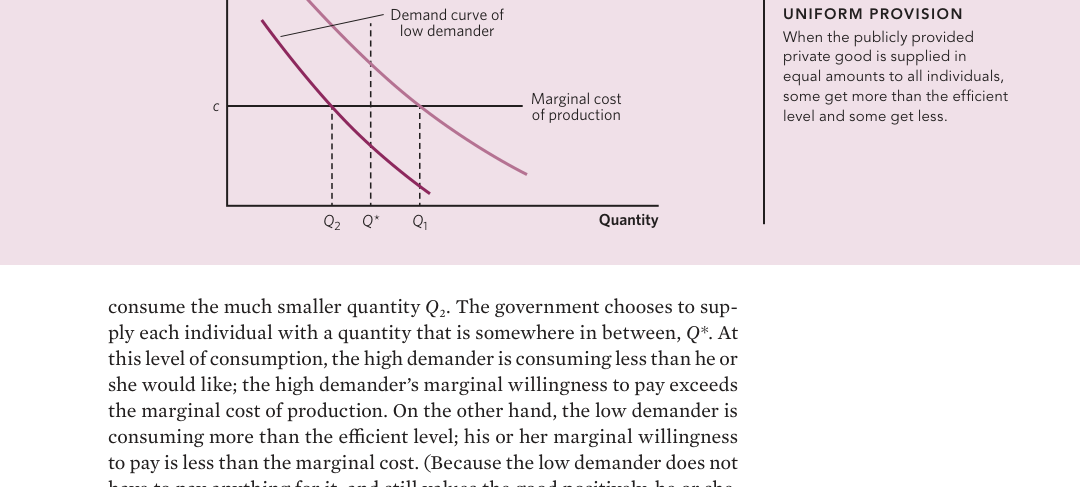
2 · Uniform Provision (same amount for all)

Advantage: saves transaction costs (no price system needed).
Disadvantage: leads some to underconsumption, others to overconsumption. High-demand consumers often buy additional amounts on the private market (private schools alongside public ones).

Uniform Provision problem
Figure 5.5 · Uniform Provision If the state provides everyone the quantity Qs: Individual 1 (high-demander) would privately consume Q1 > Qs — they buy extra. Individual 2 (low-demander) would choose Q2 < Qs — they are oversupplied. Both losses are the shaded areas.

3 · Queueing

Advantage: self-selection — those most willing to wait get the good. Possibly fairer than price rationing.
Disadvantage: time is inefficiently burned. An hour in line is just as "lost" as an hour of work. Example: waiting lists for organ transplants, hospital admissions in some countries.

Three Methods of Rationing — Summary Table
MethodAdvantageDisadvantage
User FeeThose who benefit payUnderconsumption; admin costs
Uniform ProvisionSaves transaction costsUnder-/overconsumption, two-tier market
QueueingSelf-selection: those truly in needTime is wasted

7 · How much public good should be produced?

For private goods: the market finds the efficient quantity (P = MC). For public goods individuals do not buy directly. Allocation happens through collective decisions (elections, administrative decisions, court rulings).

8 · Individual Demand for Public Goods

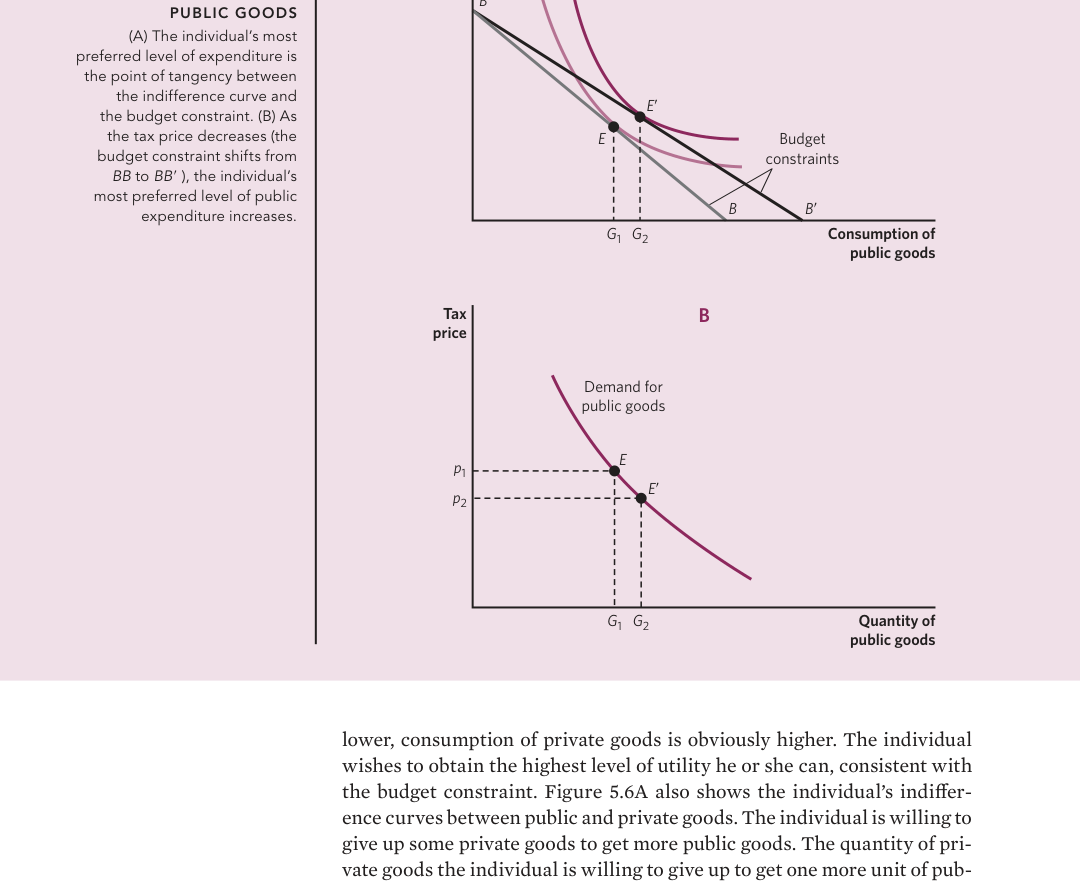
Conceptually, each individual has a preference for the quantity of public goods. Model:

  • The individual has a fixed budget split between private consumption and the public good.
  • The individual bears a tax price — the share of public spending they pay as taxes.
  • As the tax price falls, the individual wants more of the public good.
Individual demand for public goods
Figure 5.6 · Individual Demand (A) Optimum: tangent point between indifference curve and budget constraint. (B) At a lower tax price (B → B'), the optimal quantity shifts upward. This generates the individual demand curve for the public good.

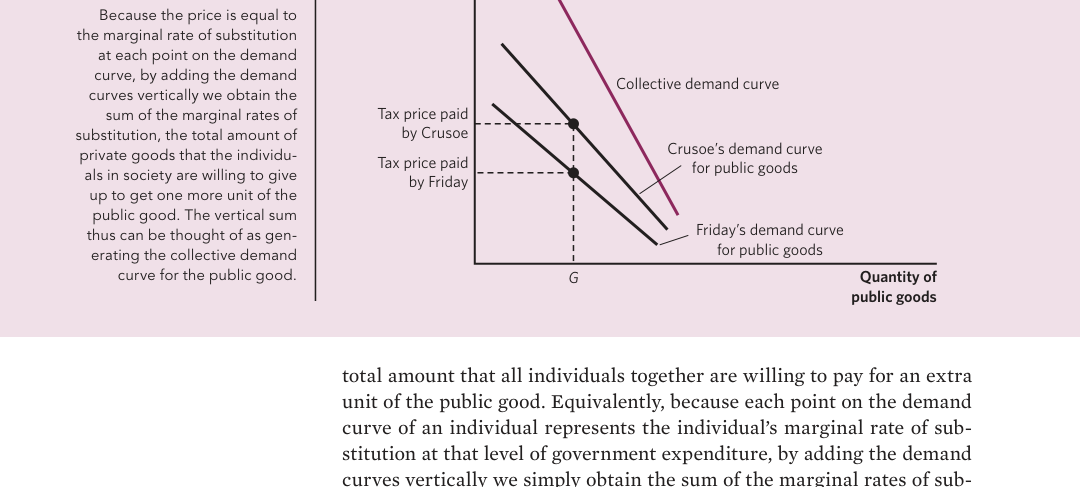
9 · Collective Demand: Vertical Summation

Here comes the key difference from private goods:

  • For private goods: market demand arises through horizontal summation (at a given price, everyone consumes their own quantity).
  • For public goods: collective demand arises through vertical summation (at a given quantity, everyone pays their own tax price).
Collective demand curve
Figure 5.7 · Vertical Summation At a given quantity G, Crusoe pays his tax price and Friday pays his. The collective demand curve is obtained by adding tax prices at each quantity (vertical sum). This is the total social willingness to pay for one unit of the public good.

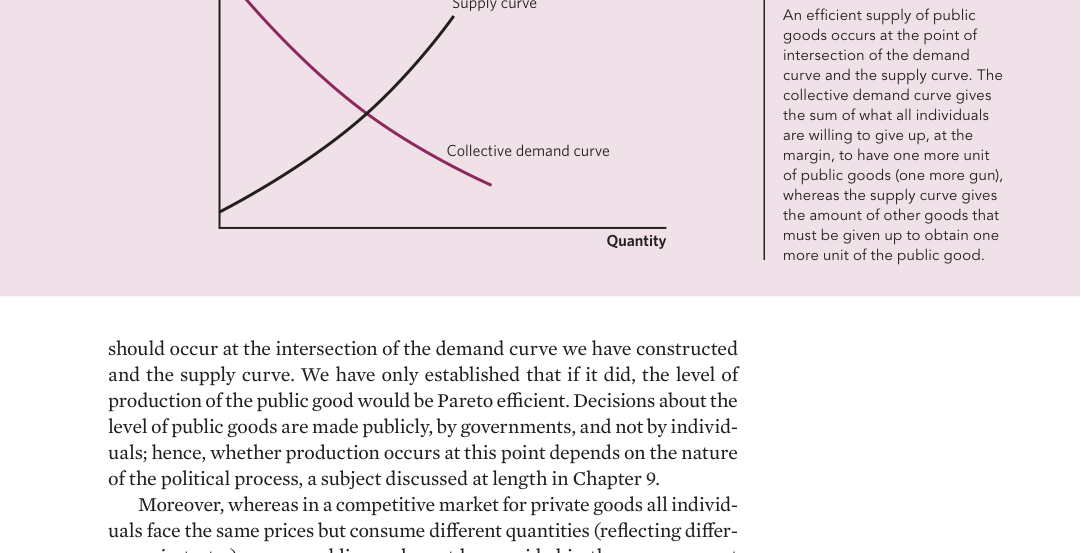
10 · Efficient Provision — Samuelson Condition

Pareto efficiency for public goods (Samuelson 1954):

Samuelson Condition Σ MRS = MRT — the sum of marginal rates of substitution across all consumers must equal the marginal rate of transformation.

Intuition: for private goods, MRS = MRT holds for each consumer. For public goods, everyone benefits simultaneously from an additional unit — hence the sum.

Efficient provision
Figure 5.8 · Efficient Provision Efficient quantity of the public good: intersection of the collective demand curve (vertically summed tax prices) and the supply curve. At this point: sum of MRS = MRT.

11 · Distribution Affects the Efficient Quantity

An important point: the efficient quantity of public goods depends on the income distribution. If income becomes more unequal, this affects the collective demand curve — and hence the optimal provision.

Unlike with private goods (where efficiency and distribution are separable, second welfare theorem), here efficiency and distribution are inseparably entangled.

12 · Distortionary Taxes and the Efficient Quantity

In practice, public goods are financed through distortionary taxes (income tax, VAT), not through ideal lump-sum transfers. Every tax has a deadweight loss.

Consequence: the actual efficient quantity of public goods is lower than the one in the ideal Samuelson model, because each additional unit means more tax burden (with DWL).

Chapter Take-away For pure public goods (non-rival, non-excludable) the market fails completely — the state must provide them. For "impure" mixed forms (club goods, publicly provided private goods) there are trade-offs between three rationing methods (fees, uniform provision, queueing). The efficient quantity of a public good follows the Samuelson condition (Σ MRS = MRT) — the vertical summation of individual demands. Unlike with private goods, the efficient quantity depends on the income distribution — efficiency and distribution are inseparable here.

Flashcards — Chapter 5

Click a card to flip it. Use arrow keys to navigate.

Term
Click to flip
Definition
Click again to flip back

Quiz — Chapter 5

14 multiple-choice questions.

Problem Set — Chapter 5

Seven open-ended exam-style questions.

1 Where do the following goods sit in Figure 5.1 (rivalry × excludability)? Justify each. (a) College education (b) National defense (c) Pay-TV programming (d) Police protection (e) Water supply

(a) College education

Rival (lecture-hall seats are limited) and excludable (admissions system). So a pure private good. Often provided publicly anyway due to positive externalities and distributional goals.

(b) National defense

Non-rival (my protection does not reduce my neighbor's) and non-excludable. A pure public good — the classic case.

(c) Pay-TV programming

Non-rival (a broadcast reaches all viewers at the same time) but excludable (subscription required). A club good. Can be privately provided — pay-TV is a good example of private provision of non-rival goods.

(d) Police protection

Mixed case. Patrol presence is more non-rival (it deters crime for everyone in the neighborhood) and non-excludable. Investigative work, by contrast, is rival (limited hours) and partly excludable (private detectives exist). Usually treated as a public good.

(e) Water supply

Rival (every liter I use is gone) and excludable (water meter). A pure private good. Still often provided publicly — because of its natural-monopoly character (the pipe network) and distributional goals (water for all).

2 Explain the free rider problem. Why does it typically get worse as more people are involved?

Mechanism

With a non-excludable good: if I do not pay, I can still consume. My consumption does not depend on my payment. Rational choice: do not pay. But everyone thinks this way → no one pays → the good is not provided.

Scaling with group size

In a small group (e.g., 5 neighbors organizing a block party), the free rider problem is moderate: everyone can see who is contributing; social pressure works; individual contributions are visibly effective.

In a large group (e.g., 300 million Americans paying for national defense), the problem becomes extreme: each individual thinks "my contribution is negligible"; anonymous non-contributors cannot be identified; one's own contribution actually has little effect. Olson (1965) showed: collective action in large groups fails without coercion or selective incentives.

Implication

For small groups, voluntary solutions are sometimes possible (housing cooperatives, beekeeper pollination). For large groups, the state is almost indispensable — with compulsory participation via taxes.

3 A bridge costs $10 million to build. Without a toll it is used by 10,000 cars per day; a $2 toll would reduce usage to 5,000. The bridge has a capacity of 15,000 cars per day. From a pure efficiency standpoint: should a toll be charged?

Analysis

At 10,000 cars per day, utilization is well below capacity (15,000). Consumption is non-rival — one extra car costs the bridge nothing (no significant additional wear, no congestion).

Efficiency

Optimal price for a non-rival good: marginal cost = $0. A toll of $2 produces:

  • 5,000 lost crossings — these people apparently valued the bridge between $0 and $2, would have liked to use it, but not at the toll price.
  • Efficiency loss (deadweight loss) = the triangle under the demand curve between 5,000 and 10,000 cars.

Recommendation

From a pure efficiency standpoint: no toll at under-utilization. The bridge should instead be financed through general taxes or one-time construction contributions.

Complications

  • If demand varies (rush hour vs. nighttime), a time-differentiated toll can make sense: $0 at night, $2 at rush hour when capacity is reached.
  • If no other funding source is available: a toll as a second-best solution — the efficiency loss from the toll may be smaller than the loss from distortionary taxes.
  • Distribution: who benefits? Who pays the alternative taxes? These distributional questions may change the recommendation.
4 What are the three classical rationing methods for publicly provided private goods? Discuss each with an example.

1 · User Fees (e.g., entrance fee for state parks)

Advantage: those who use pay — fair and reduces overconsumption.
Disadvantage: low utilization for non-rival goods (see the bridge example); administrative costs of fee collection; lower-income people are excluded.

2 · Uniform Provision (e.g., public school education)

All children receive the same educational offering, regardless of need.
Advantage: saves transaction costs; egalitarian character.
Disadvantage: high-demand families switch to private schools (two-tier system); low-demanders are oversupplied (in some communities, families reject expensive enrichment programs).

3 · Queueing (e.g., organ transplants, hospital admissions)

Those with the most urgent need go first — triage logic.
Advantage: self-selection of those truly in need; non-monetary allocation.
Disadvantage: time is literally wasted; arbitrary factors (when one gets on the list) decide outcomes; poor management of acute emergencies.

Combinations

In practice, mixed forms are often used: hospital emergency admissions are queue-free (triage by severity); elective procedures are queue-based; some services use co-payments (small user fees).

5 What is the Samuelson condition for efficient provision of public goods? Why does it differ from the efficiency condition for private goods?

Samuelson Condition

Σ MRS = MRT. The sum of marginal rates of substitution across all consumers must equal the marginal rate of transformation.

For private goods

MRS = MRT for each individual consumer. This works because each consumer chooses their own quantity.

For public goods

An additional unit of the public good is enjoyed by everyone simultaneously. The country gets one additional patrol; I benefit, my neighbor benefits, everyone benefits at once. Hence: the marginal social benefit = sum of all individual marginal benefits.

Mathematically

For an efficient level the social marginal benefit must equal the marginal cost: Σ MRS = MRT. That is the Pareto-efficient point.

Practical problem

How do we measure Σ MRS? When the government asks "how much are public goods worth to you?", citizens systematically lie — either too little (free riding) or too much (when they do not pay themselves). This is the famous preference revelation problem of public goods.

6 Explain the difference between horizontal and vertical summation of demand curves. When is each used?

Horizontal Summation — Private Goods

For a private good: each consumer consumes their own quantity. At a given price P, consumers A and B have different desired quantities. Market demand = Σ (quantityA, quantityB, …) at each price.

Geometrically: at each price level, add the quantities horizontally.

Vertical Summation — Public Goods

For a public good: all consumers consume the same quantity (national defense is provided as a single quantity). But each has a different willingness to pay. Collective demand = Σ (PA, PB, …) at each quantity.

Geometrically: at each quantity level, add the willingness-to-pay values vertically.

Intuition

For private goods: everyone faces the same price, chooses different quantities. For public goods: everyone gets the same quantity, pays different tax prices. Hence the axes are inverted when summing.

Consequence

The collective demand curve for public goods is steeper than any individual demand curve — unlike with private goods, where market demand is flatter. As a result, the optimal public quantity typically lies above the maximum individual demand.

7 A student claims: "For public goods, efficiency and distribution are separable — the state should first produce the efficient quantity and then redistribute." Is this correct?

For private goods: separation is possible

The second welfare theorem guarantees: any Pareto-efficient allocation can be reached via market + lump-sum redistribution. Efficiency and distribution are analytically separable.

For public goods: NO separation

The efficient quantity of a public good depends on the income distribution. Here is why:

  • High incomes → more demand for public goods (for normal goods).
  • If income is redistributed from rich to poor: high earners want less of the public good, low earners want more — the net effect is not trivial.
  • The Samuelson condition Σ MRS = MRT involves everyone's MRS — and MRS depends on income.

Concrete example

When education is provided publicly: in an unequal society, the rich want private schools and the poor rely on public schools. The politically chosen education budget depends on this distribution.

Answer

The student's claim is false for public goods. Efficiency and distribution are inseparably entangled here — one of the central themes of public economics. In practice, this means: the questions "how much public good?" and "how do we redistribute?" must be answered together.